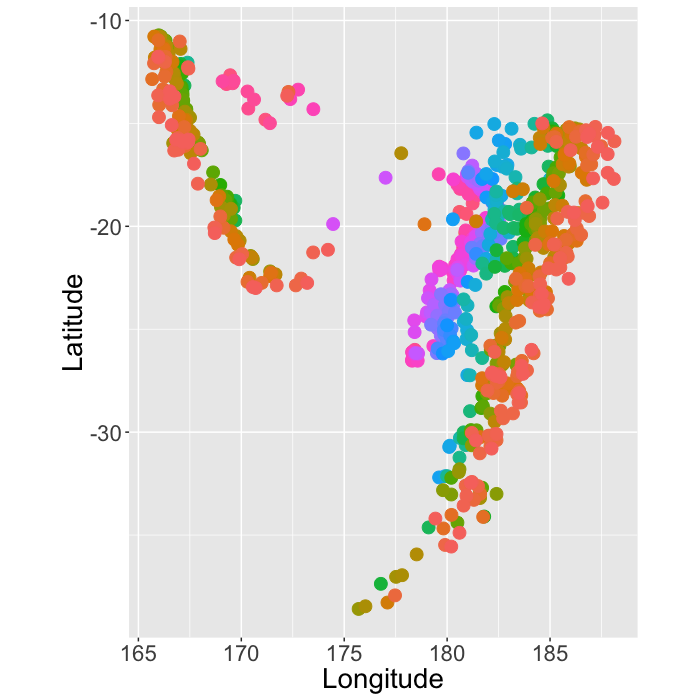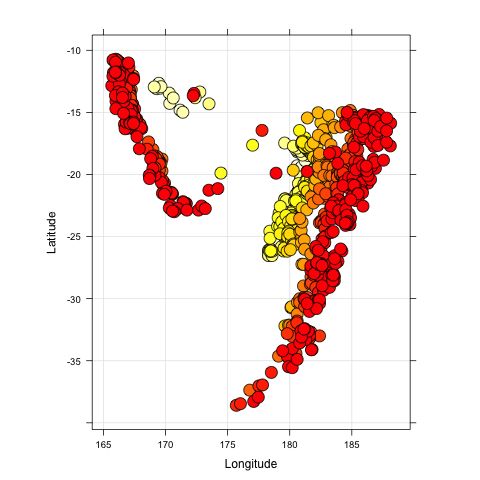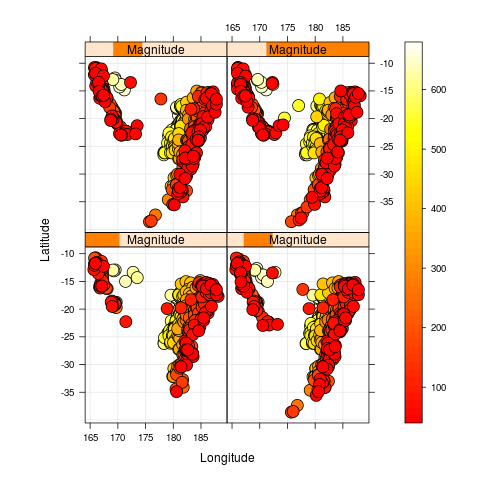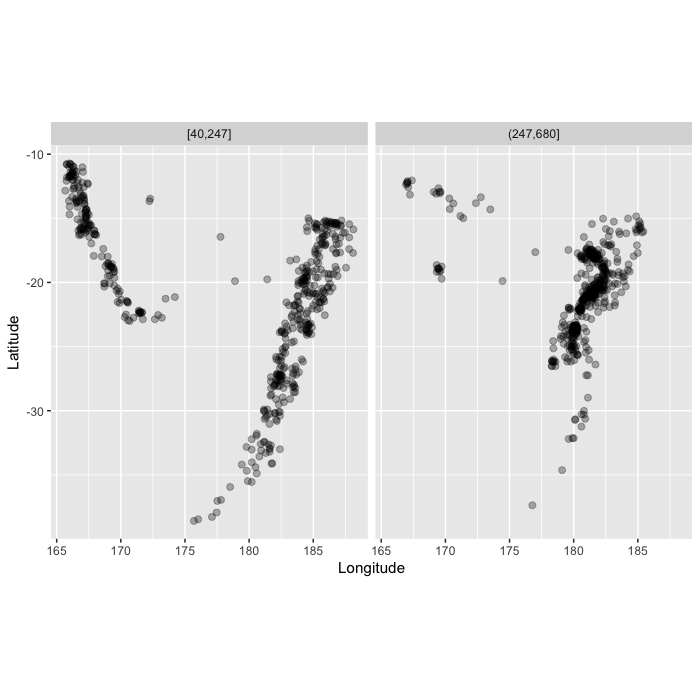
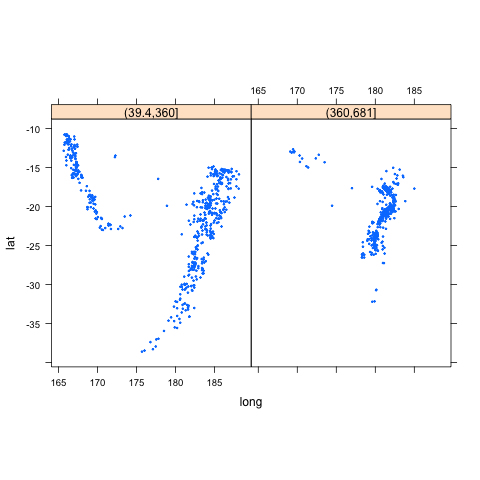
This page illustrates graphical analysis of hypervariate data, using figures from Chapter 5 of Visualizing Data, by William Cleveland and Lattice: Multivariate Data Visualization in R, by Depanyan Sarkar. Figures were made with ggplot2 (left column) and Lattice (right column). Click on a figure to see the code that made it.