GEOG
1100
Exploring
the World Through Google Earth
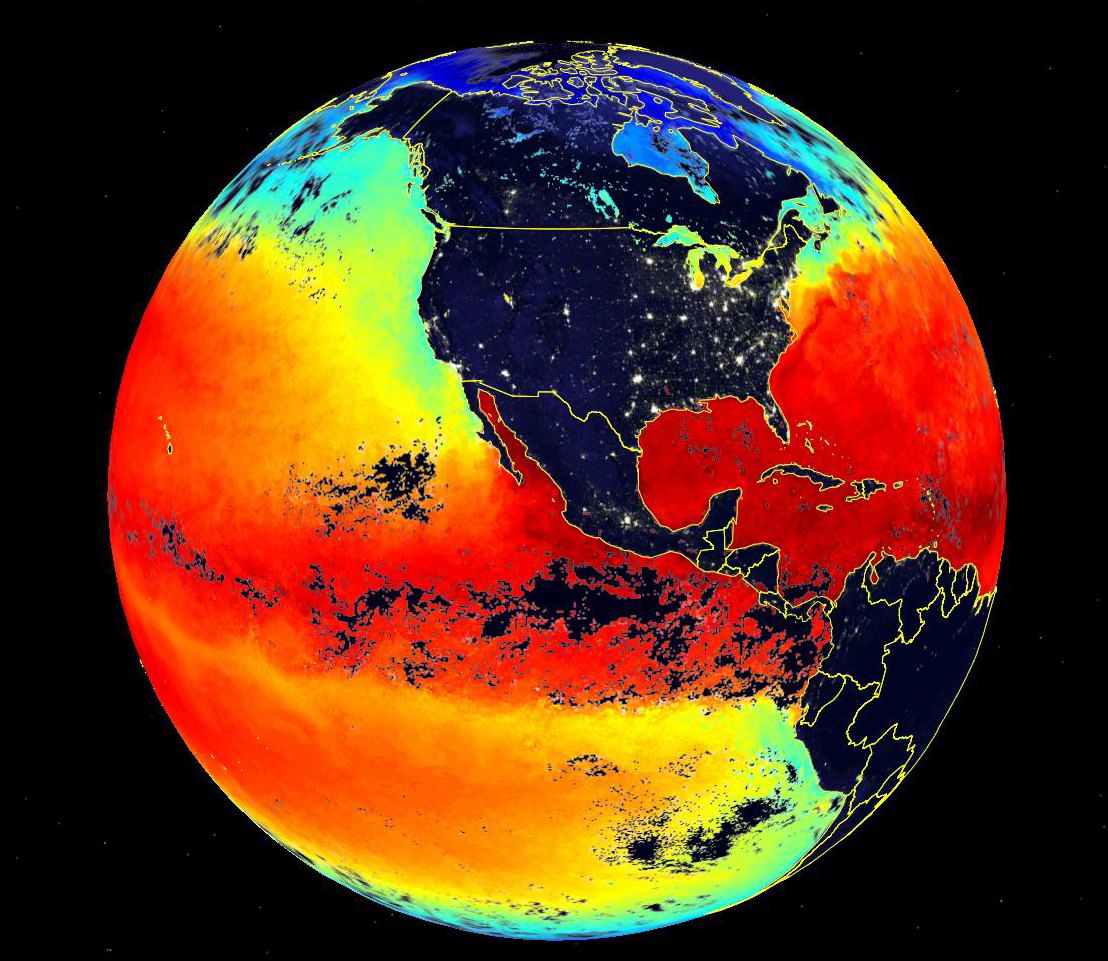
In this visualization created by Google Earth, warmer colors indicate hotter sea surface temperatures and white clusters show areas of high population density.
In this visualization created by Google Earth, warmer colors indicate hotter sea surface temperatures and white clusters show areas of high population density.
Social and environmental changes
are occurring at rates never before
witnessed in the history of humanity. Geographic data have
revolutionized our view of the physical and human processes causing
global change, and Google
Earth has greatly increased our ability to access and visualize
these data. This course uses Google Earth as a tool to investigate
important geographic processes that are responsible for global change
phenomena. Some of the topics we will examine during the semester
include:
|
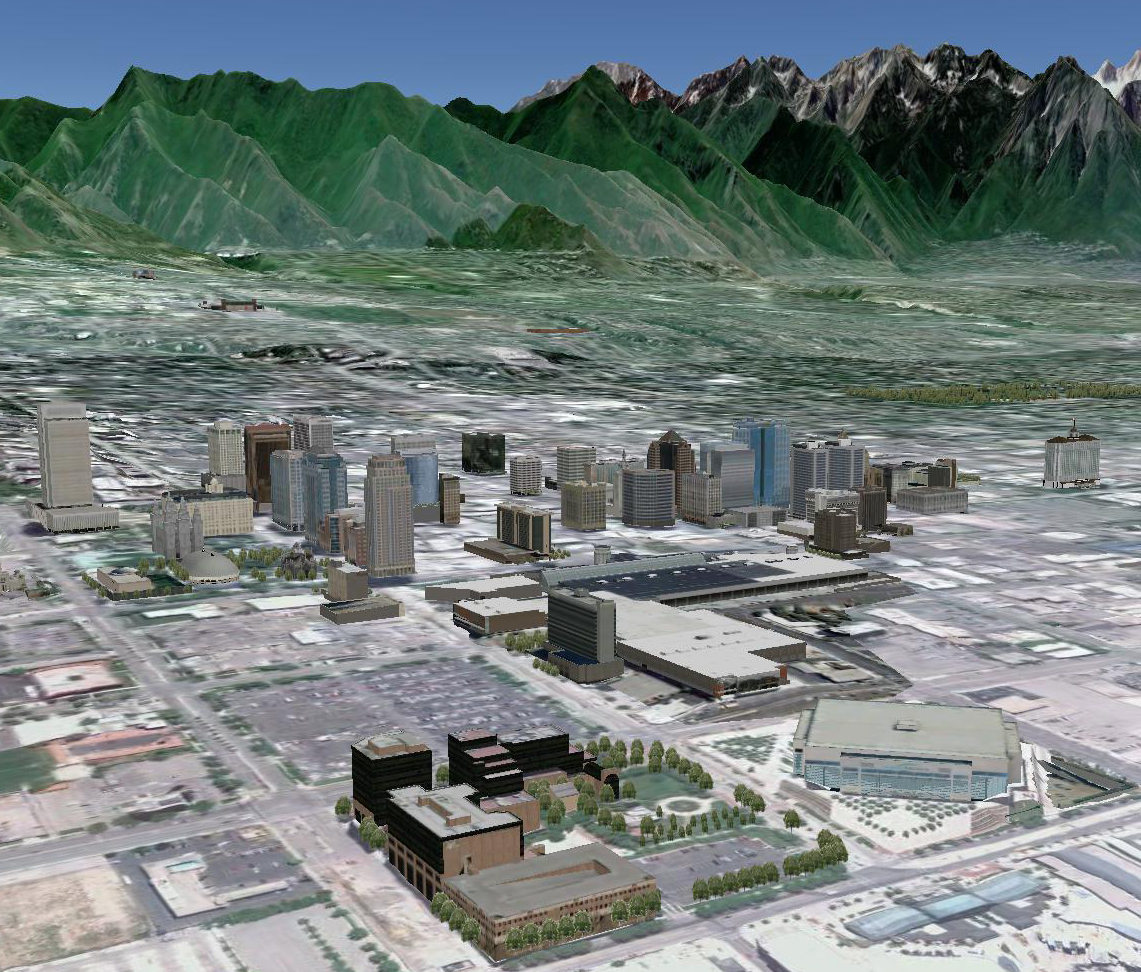 A view of downtown Salt Lake City, including 3-d buildings rendered by Google Earth |
In lecture we will discuss the science behind these topics. Self-guided labs will use Google Earth to analyze datasets related to each topic. This is a great class for anyone interested in environmental issues, environmental changes at regional and global scales, and interactions between humans and the environment.
This class fulfills the physical/life science exploration (SF) requirement.